
AbiBin Product · 02
QikAnalytix
Desktop analytics with an AI chart assistant. Your data never leaves your machine.
QikAnalytix is a desktop analytics application. You load a CSV or Excel file, it detects your columns and types, and you build charts by dragging or by asking VizBOT in plain English. There is no server to send your data to — the application runs on your machine, and so does your data.
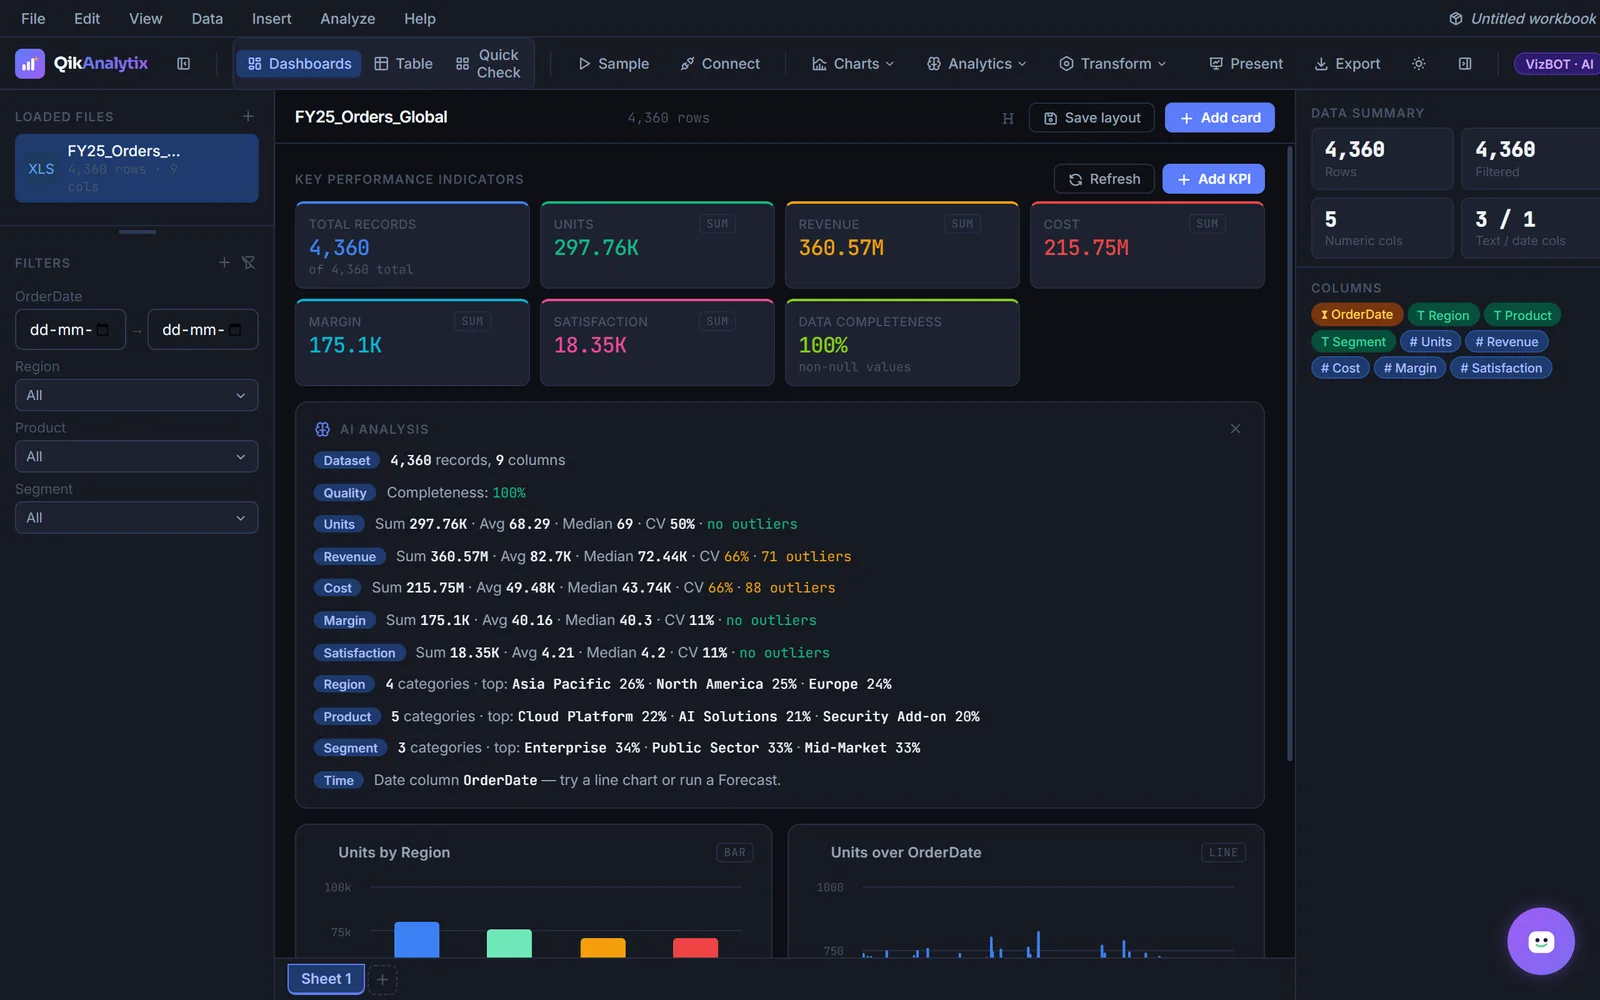
Load a file and QikAnalytix profiles it — KPIs, outliers and column types, before you build a thing.
What it does
Built around the work you actually do.
Connect to your data
Drag in a CSV or Excel file, or connect straight to SQL Server, PostgreSQL, a REST API, Google Sheets, SharePoint or ODBC. Column types are detected automatically and several sources can be open at once.
VizBOT, the AI chart assistant
Describe the chart you want in plain English and VizBOT builds it against the file you have loaded.
A real chart library
Bar, line, spline, area, pie, doughnut, scatter, bubble, heatmap, treemap, funnel, waterfall, box plot, bullet, combo and forecast — plus table, pivot, text and image cards.
Slicers and filters
Every categorical column becomes a slicer. Filtering updates every chart, KPI and table on the canvas in real time.
Runs offline
No backend server and no cloud account. The application installs as a Windows executable and activates against an offline licence key.
Your data stays local
Because there is no server, your spreadsheet is never uploaded anywhere. For teams handling commercially sensitive data, that is the whole argument.
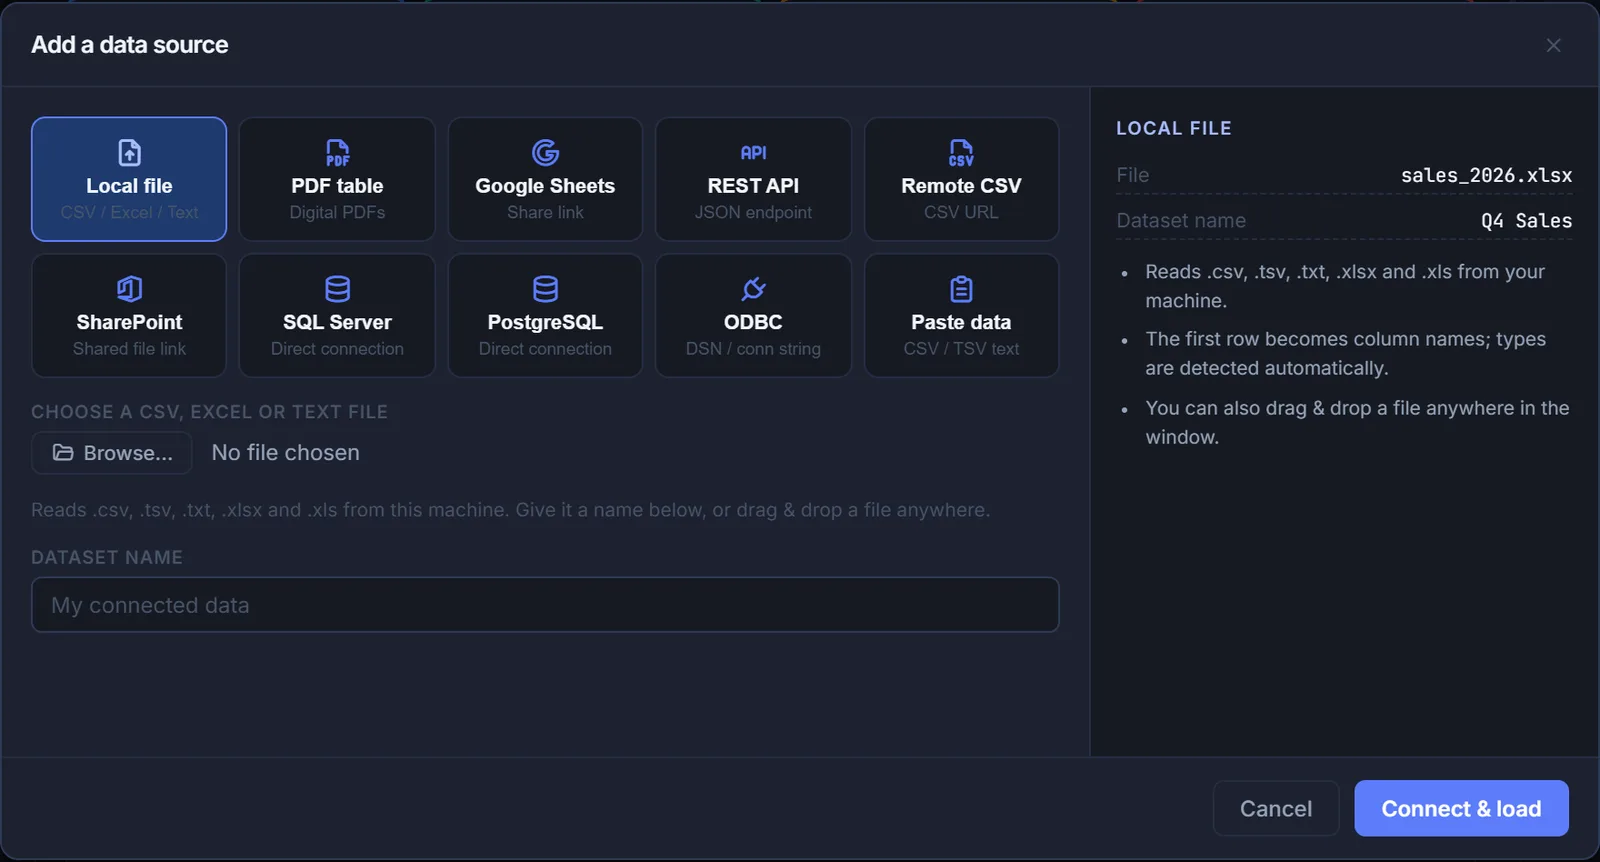
Connect to your data
Drag in a CSV or Excel file, or connect straight to SQL Server, PostgreSQL, a REST API, Google Sheets, SharePoint or ODBC. Column types are detected automatically and several sources can be open at once.
Files are only the start — SQL Server, PostgreSQL, REST APIs, Google Sheets and ODBC connect directly.
VizBOT, the AI chart assistant
Describe the chart you want in plain English and VizBOT builds it against the file you have loaded.
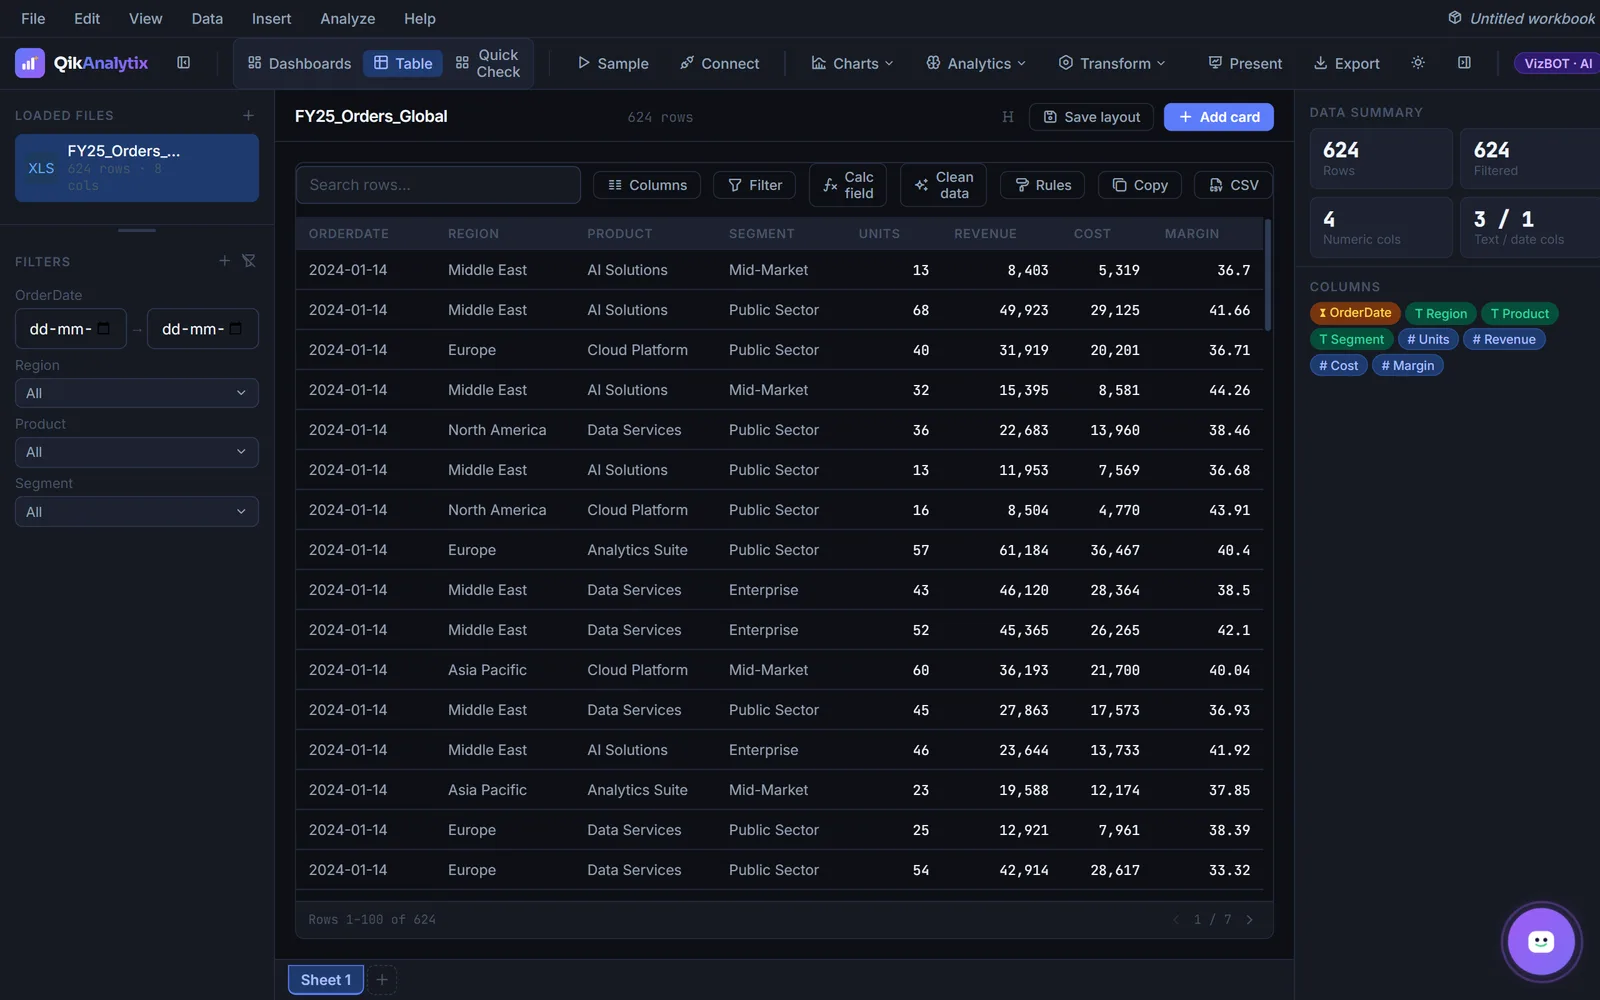
The grid, with filters, calculated fields and cleaning tools beside it.
Who it's for
Made for the people who run it.
Analysts handling sensitive data
Finance, healthcare and legal teams who cannot upload a client spreadsheet to a cloud BI tool.
Teams without a data warehouse
If your reporting starts from files rather than a warehouse, this meets the data where it already is.
People who want charts, not a project
No modelling layer to learn first. Load the file and ask for the chart.
Free Download
The QikAnalytix brochure.
Enter your details and the PDF downloads immediately.
Questions
About QikAnalytix.
No. It is a desktop application, packaged as a Windows installer. There is no backend server, no account to create and no data upload. This is a deliberate design decision, not a limitation.
Your data stays on your machine. The application has no server to send it to.
An AI assistant built into the application. You describe the chart you want in plain language and it builds it against the data you have loaded.
Local CSV, XLSX and XLS files, and tables extracted from PDFs. It also connects directly to SQL Server, PostgreSQL, ODBC sources, REST APIs, Google Sheets, SharePoint and remote CSV URLs. Column types are detected automatically on load.
Through an offline licence key activated on the machine. Contact us for licensing options for teams.

Ready to start?
Let's build something
that lasts.
Whether you're modernising infrastructure, training your team, or re-thinking your analytics strategy — we'll show you how.
43+
Clients
99%
On-time delivery
ISO
9001
Certified